Assume, you have a Feathers.js app and want to debug it. In this post, we will learn how to debug Feathers.js app using debuggers in Chrome and Webstorm. You need to have Nodemon installed. In this post, we will use Nodemon of version 2.0.4.
Create a Node.js build
You need to create a build of your Feathers.js app to continue with debugging. Usually, you can do this using the npm run build and it will create dist/ or build/ folder.
Start the Debugger
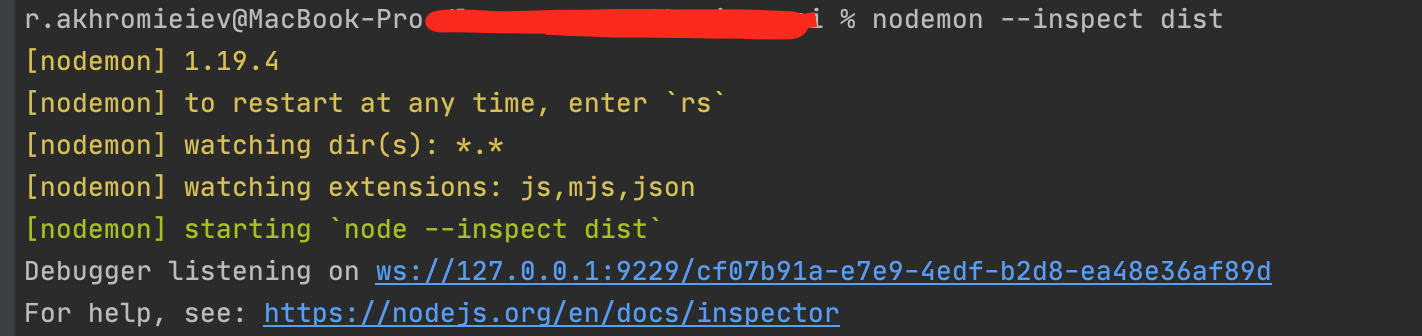
To run a project with debugger you need to pass inspect flag along with nodemon. Run this command in your project (dist/ folder should be in the root):
nodemon --inspect dist/
You should see the Websocket link where you can debug a Node.js application. In our case, it is the Feathers.js app.
Debug Node.js app in Webstorm
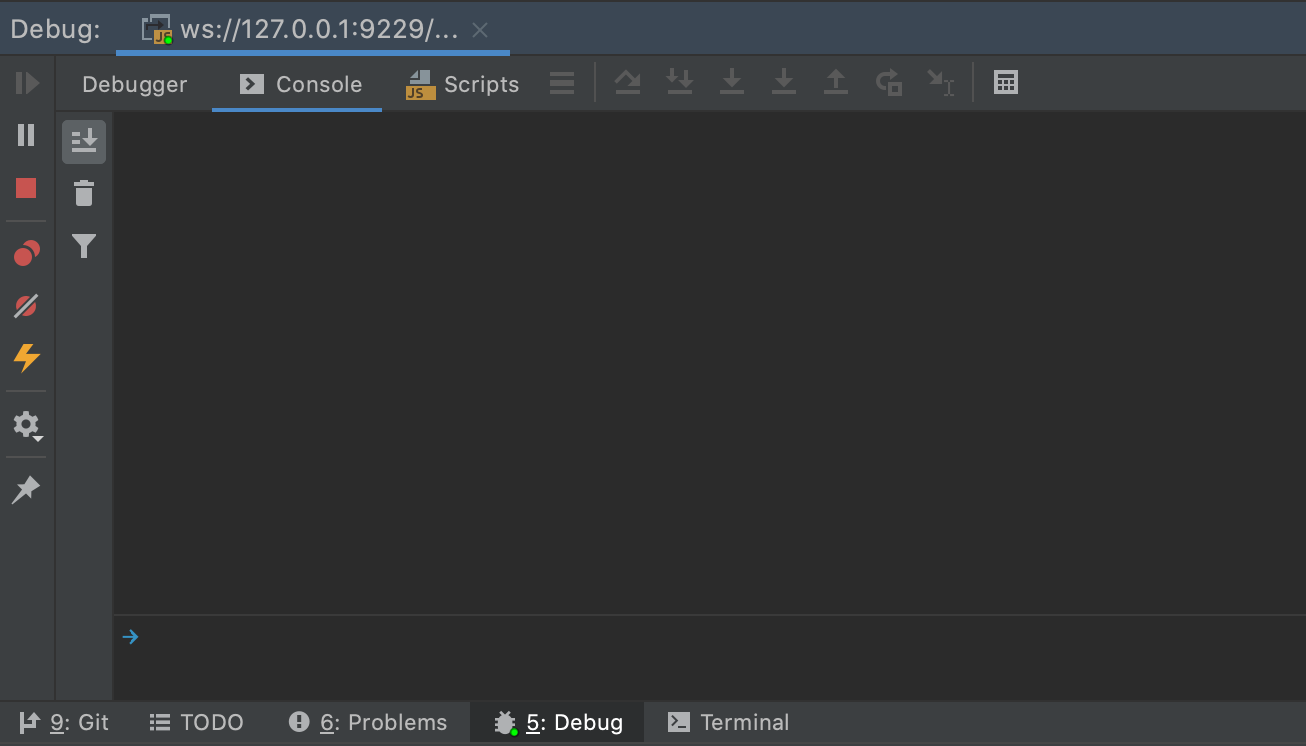
You can debug your app directly in Webstorm. Just click on the link from the previous section. Before this, you can set breakpoints in Webstorm IDE.
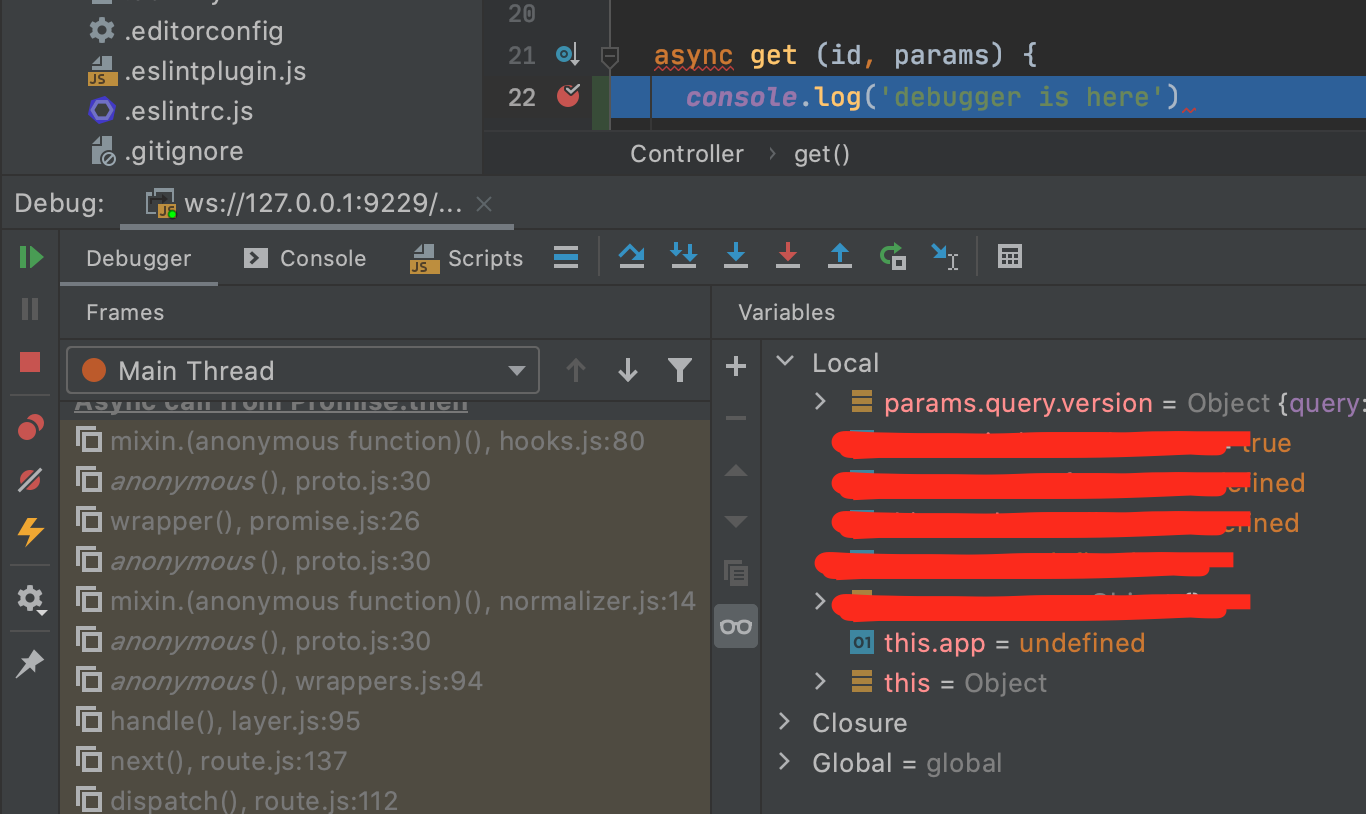
When breakpoint will be reached you can see information about variables and methods.
Debug Node.js app in the Chrome browser
To debug the Node.js app in the Chrome browser you need to open Chrome DevTools while nodemon --inspect is working. You should face a Node.js icon in the top-left corner. Just click on it and you can continue with debugging:
comments powered by DisqusP.S. This tutorial can be used for another Node.js framework. The approach is the same.